MESMA
Theoretical overview
A spectral mixing technique called Multiple Endmember Spectral Mixture Analysis (MESMA) is at the core of the plugin. MESMA is an extension of simple Spectral Mixture Analysis (SMA).
In simple SMA, a spectrum is modelled as the sum of pure spectra called endmembers, each weighted by the fraction of an endmember required to produce the mixture ([Adams1993], [Roberts1993], [Settle1993]). SMA has an advantage over many competing approaches in that it provides physically meaningful measures of cover that account for subpixel mixing.
While SMA is a powerful approach, it fails to account for pixel-scale variability in spectral dimensionality, spectral degeneracy between materials and natural variation in the spectra of most materials. The latter is often referred to as endmember variability (Somers et al. [Somers2011]). As a result, simple SMA under-utilizes the potential of most remote sensing data sets for discriminating materials, while at the same time producing fractional errors due to the incorrect type or number of endmembers used to unmix a specific pixel.
MESMA extends SMA by allowing the number and types of endmembers to vary on a per-pixel basis (Roberts et al. [Roberts1998]). MESMA overcomes limitations of SMA by requiring a model to meet minimum fit, fraction and residual constraints while testing multiple models for each image pixel.
MESMA is typically implemented by developing a spectral library, then unmixing an image using every possible combination of two, three, four or more endmembers applied to each pixel. Using this approach, significantly more than four materials can be mapped across an image, while minimizing pixel-scale fraction errors by selecting the best-fit model for each pixel.
Some of the earliest applications of MESMA were in snow-cover/snow-area mapping ([Painter1998]; [Painter2003]), plant species mapping in chaparral ([Roberts1998]; [Dennison2003a]; [Dennison2003b]; [Roberts2003]), urban remote sensing ([Rashed2003]; [Powell2007]; [Franke2009]), soil mapping in arid lands ([Okin2000]), improved estimation of LAI in boreal forests ([Sonnentag2007]), land form mapping in North Africa using MODIS ([Ballantine2005]), fire temperature mapping ([Dennison2006]; [Eckmann2009]), post-fire recovery in chaparral ([Peterson2003]), fire severity mapping ([Quintano2013]), surface coal-mine mapping ([Fernando2012]), shape-based temporal compositing ([Dennison2007]) and several planetary applications ([Li2003]; [Johnson2006]).
Since 2009, MESMA has become an increasingly valuable approach for classification and biophysical mapping. Somers et al. [Somers2009] introduced the concept of band weighting, in which endmember variability (Somers et al. [Somers2011]) is suppressed by selecting subsets of wavelengths that have the lowest impact on spectral fractions for a class (e.g., improved separability of endmembers). A key component of this work was the introduction of the Instability Index (ISI), which is calculated as the ratio of spectral variability within a class to spectral variability between classes, in which spectral variability is quantified using the coefficient of variation. The ideal wavelength subset will minimize the former and maximize the latter.
ISI was further extended to the concept of Stable Zone Unmixing (SZU; [Somers2010]), in which a band subset is selected that minimizes within class endmember variability and maximizes between class variability. Peterson et al. [Peterson2015] demonstrated that SZU improved the ability to discriminate oil-vegetation from NPV along the Gulf coast, following the Deepwater Horizon oil spill. Youngentob et al. [Youngentob2011] introduced the concept of using continuum-removed spectra and MESMA to discriminate Eucalyptus sub-genera. Variants of MESMA were applied to time series data by Somers and Asner ([Somers2013], [Somers2014]) to map invasive forest species in the Hawaiian islands.
Quantitative comparisons of reference fractions to estimates using SMA or MESMA have proven to be highly accurate over a diverse number of surfaces (e.g. [Elmore2000]; [Painter2003]; [Powell2007]; [Roberts2012]; [Roberts2015]; [Roberts2017]). Incorporating endmember variability, for example, was attributed by Roberts et al. [Roberts2012] as a primary factor leading to high fractional accuracy in mapping impervious surface fractions in urban areas.
Endmembers used in SMA or MESMA can be derived from an image (image endmembers), or from a library of known materials (reference endmembers). Reference endmembers can be derived from the field, laboratory, images or even radiative transfer models. Typical endmembers used in SMA include soil, green vegetation (GV), non-photosynthetic vegetation (NPV), impervious surfaces, and shade. Identifying a high quality set of reference or image endmembers is a critical stage of mixture modelling ([Tompkins1997]).
While MESMA is a powerful approach, several factors have limited its use. One of the major limitations has been a lack of easily used software. One of the key goals of the MESMA plugin is to address this lack of software. Another limitation has been the challenges in selecting endmembers to be used in MESMA. In its earliest implementations, MESMA was typically employed using hundreds of endmembers, resulting in significant challenges in interpretation and computation.
More recently, efforts have been made to fine tune the analysis by selecting optimal sets of endmembers from a spectral library prior to running MESMA (library pruning). A key goal is to identify those spectra that are most representative of a specific class, yet also least likely to be confused with spectra from a different class.
A number of approaches have been developed for identifying endmembers including the Pixel Purity Index (PPI) [Boardman1995], manual selection [Bateson1996], Endmember Bundles [Bateson2000], Constrained Reference Endmember Selection (CRES) [Roberts1993], Count-based Endmember Selection (CoB) [Roberts2003], Endmember Average RMSE (EAR) [Dennison2003a], Minimum Average Spectral Angle (MASA) [Dennison2004] and Iterative Endmember Selection (IES) [Roth2012].
Five techniques used for identifying optimal endmembers are included in the Spectral Library Tool and are discussed in detail on the tools website (https://spectral-libraries.readthedocs.io) : EAR, MASA and COB (collectively EMC), CRES and IES.
MESMA Tool
Once you have developed a spectral library, you can run mixture models using this tool. Again, the metadata belonging to the library is very important as it determines the classification of the spectra in the library.
The tool allows a user to select the model complexity, and to choose which classes to run and which models within a class to run. The tool also allows to set constraint options, including a minimum and maximum shade constraint.
The tool also performs multi-level fusion, allowing the user to adjust the RMSE threshold constraint.
The tool includes two shade options, photometric shade, in which the shade defaults to zero reflectance, or non-photometric shade, which enables a user to provide a shade spectrum from a spectral library.
Finally, two band selection options are included: spectral weighting as implemented in Somers et al. [Somers2009] and band selection using SZU [Somers2010].
In the case of multiple models, the best single model for each pixel will be selected based on minimum RMSE.
When running this tool, several items should be noted:
- The number of bands and the band positions of the image and all spectral libraries used must be an exact match.
- It is possible to run the same model on multiple images by selecting multiple, rather than a single, input file. When doing this, a user should turn off the option “Open images for Viewing” to minimize clutter and computational overhead. Output files will be assigned automatically in this case rather than being assigned by the user.
MESMA Output
The output file names are all built, by default, like: ImageName_mesma_YYYMMDDThhmmss. There are 3 images and 2 metadata files:

- a models image (models given in the form of the endmember number of the spectral library)
- a fraction image (_fractions)
- an RMSE image (_rmse)
The models image is not human readable and should be opened with the MESMA Visualisation Tool.
MESMA Visualisation Tool
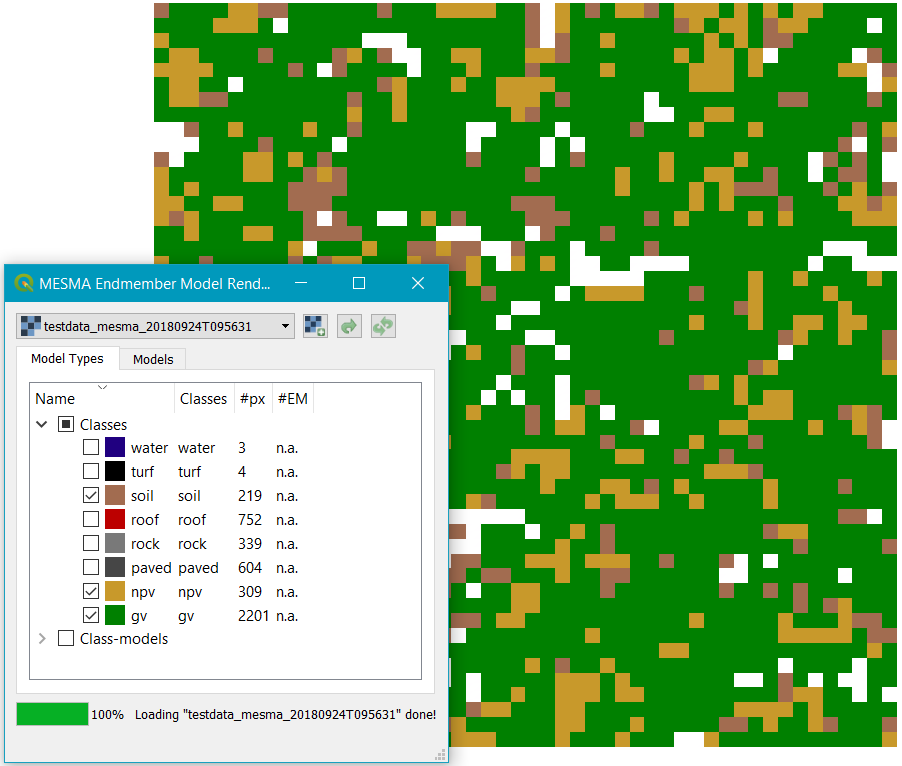
As a user, we want to interpret the results of MESMA. Where can we find what class? Where can we find what mixture? We could analyse the “models” image band by band (i.e. class by class), but this is rather tedious.
A better option is to use the Visualisation Tool included in the toolbox:
- From the drop down menu, select the models image.
- In case the layer is not yet open in QGIS, use the Add Raster button
to open it.
- Make sure it is the top layer in the table of contents menu, or the only layer turned on.
- Automatically, all classes and class-models are displayed in a tree-structure.
- Now you can turn classes on and off and change their colours.
- View the result on the map canvas by using the Show button
.
- In case you are not satisfied with the colours, you can undo all changes with the Refresh button
.
As a user, you must be aware that a pixel can contain multiple classes. It is therefore not very useful to try and display several classes (e.g. “green vegetation” or “soil”) at the same time. Because of the overlap, only the top class will be shown on the map canvas.
ACKNOWLEDGMENTS
This user guide is based on the VIPER Tools 2.0 user guide (UC Santa Barbara, VIPER Lab): Roberts, D. A., Halligan, K., Dennison, P., Dudley, K., Somers, B., Crabbe, A., 2018, Viper Tools User Manual, Version 2, 91 pp.
CITATIONS
| [Adams1993] | Adams JB, Smith MO and Gillespie, AR. 1993. Remote geochemical analysis: elemental and mineralogical composition. Chapter: Imaging spectrometry: interpretation based on spectral mixture analysis. Cambridge University Press, volume 7, p. 145-166. |
| [Ballantine2005] | Ballantine JAC, Okin GS, Prentiss DE and Roberts DA. 2005. Mapping African landforms using continental scale unmixing of MODIS imagery. Remote Sensing of Environment, volume 97, p. 470-483. |
| [Bateson1996] | Bateson A and Curtiss B. 1996. A method for manual endmember selection and spectral unmixing. Remote Sensing of Environment, volume 55, p. 229-243. |
| [Bateson2000] | Bateson CA, Asner GP and Wessman C. 2000. Endmember Bundles: A new approach to incorporating endmember variability into spectral mixture analysis. IEEE Transactions on Geoscience and Remote Sensing, volume 38, p. 1083-1094. |
| [Boardman1995] | Boardman JW, Kruse FA and Green RO. 1995. Mapping target signatures via partial unmixing of AVIRIS data. Summaries of the 5th JPL Airborne Earth Science Workshop, JPL Publication 95, p. 23-26. |
| [Dennison2003a] | (1, 2) Dennison PE, Roberts DA. 2003. Endmember Selection for Multiple Endmember Spectral Mixture Analysis using Endmember Average RSME. Remote Sensing of Environment, volume 87, p. 123-135. |
| [Dennison2003b] | Dennison PE, Roberts DA. 2003. The Effects of Vegetation Phenology on Endmember Selection and Species Mapping in Southern California Chaparral. Remote Sensing of Environment, volume 87, p. 295-309. |
| [Dennison2004] | Dennison PE, Halligan KQ and Roberts DA. 2004. A Comparison of Error Metrics and Constraints for Multiple Endmember Spectral Mixture Analysis and Spectral Angle Mapper. Remote Sensing of Environment, volume 93, p. 359-367. |
| [Dennison2006] | Dennison PE, Charoensiri K, Roberts DA, Peterson SH and Green RO. 2006. Wildfire temperature and Land Cover Modeling Using Hyperspectral Data. Remote Sensing of Environment, volume 100, p. 212-222. |
| [Dennison2007] | Dennison PE, Roberts DA, Peterson SH. 2007. Spectral shape-based temporal compositing algorithms for MODIS surface reflectance data. Remote Sensing of Environment, volume 109, p. 510-522. |
| [Eckmann2009] | Eckmann T, Roberts DA and Still C. 2009. Estimating subpixel fire sizes and temperatures from ASTER using multiple endmember spectral mixture analysis. International Journal of Remote Sensing, volume 30, p. 5851-5864. |
| [Elmore2000] | Elmore AJ, Mustard JF, Manning SJ and Lobell DB. 2000. Quantifying vegetation change in semiarid environments: precision and accuracy of spectral mixture analysis and the normalized difference vegetation index}. Remote Sensing of Environment, volume 73, p. 87-102. |
| [Fernando2012] | Fernando-Manso A, Quintano C and Roberts DA. 2012. Evaluation of potential of multiple endmember spectral mixture analysis (MESMA) for surface coal mining affected area mapping in different world forest ecosystems. Remote Sensing of Environment, volume 127, p. 181-192. |
| [Franke2009] | Franke J, Roberts DA, Halligan K and Menz G. 2009. Hierarchical Multiple Endmember Spectral Mixture Analysis (MESMA) of hyperspectral imagery for urban environments. Remote Sensing of Environment, volume 113, p. 1712-1723. |
| [Johnson2006] | Johnson JR, Staid MI, Titus TN, Becker K. 2006. Shocked plagioclase signatures in Thermal Emission Spectrometer Data of Mars. Icarus, volume 180, p. 60-74. |
| [Li2003] | Li L and Mustard JF. 2003. Highland contamination in lunar mare soils: Improved mapping with multiple end-member spectral mixture analysis. Journal of Geophysical Research, volume 108, p. 7-1 to 7-14. |
| [Okin2000] | Okin GS, Roberts DA, Murray B and Okin WJ. 2000. Practical limits on hyperspectral vegetation discrimination in arid and semiarid environments. Remote Sensing of Environment, volume 77, p. 212-225. |
| [Painter1998] | Painter TH, Roberts DA, Green RO and Dozier J. 1998. The Effect of Grain Size on Spectral Mixture Analysis of Snow-covered Area from AVIRIS Data. Remote Sensing of Environment, volume 65, p. 320-332. |
| [Painter2003] | (1, 2) Painter TH, Dozier J, Roberts DA, Davis RE and Green RO. 2003. Retrieval of Subpixel Snow-covered Area and Grain Size from Imaging Spectrometer Data. Remote Sensing of Environment, volume 85, p. 64-77. |
| [Peterson2003] | Peterson SH and Stow DA. 2003. Using multiple image endmember spectral mixture analysis to study chaparral regrowth in southern California. International Journal of Remote Sensing, volume 24, p. 4481-4504. |
| [Peterson2015] | Peterson SH, Roberts DA, Beland M, Kokaly RF and Ustin SL. 2015. Oil detection in the coastal marshes of Louisiana using MESMA applied to band subsets of AVIRIS data. Remote Sensing of Environment, volume 159, p. 222-231. |
| [Powell2007] | (1, 2) Powell R, Roberts DA, Dennison PE and Hess LL. 2007. Sub-pixel mapping of urban land cover using multiple endmember spectral mixture analysis: Manaus, Brazil. Remote Sensing of Environment, volume 106, p. 253-267. |
| [Quintano2013] | Quintano C, Fernando-Manso A and Roberts DA. 2013. Multiple Endmember Spectral Mixture Analysis (MESMA) to map burn severity levels from Landsat images in Mediterranean countries. Remote Sensing of Environment, volume 136, p. 76-88. |
| [Rashed2003] | Rashed T, Weeks JR, Roberts DA, Rogan J and Powell R. 2003. Measuring the Physical Composition of Urban Morphology using Multiple Endmember Spectral Mixture Models. Photogrammetric Engineering and Remote Sensing, volume 69, p. 1011-1020. |
| [Roberts1993] | (1, 2) Roberts DA, Adams JB and Smith MO. 1993. Discriminating Green Vegetation, Non-Photosynthetic Vegetation and Soils in AVIRIS Data. Remote Sensing of Environment, volume 44, p. 255-270. |
| [Roberts1998] | (1, 2) Roberts DA, Gardner M, Church R, Ustin S, Scheer G and Green RO. 1998. Mapping Chaparral in the Santa Monica Mountains using Multiple Endmember Spectral Mixture Models, Remote Sensing of Environment, volume 65, p. 267-279. |
| [Roberts2003] | (1, 2) Roberts DA, Dennison PE, Gardner M, Hetzel Y, Ustin SL and Lee C. 2003. Evaluation of the Potential of Hyperion for Fire Danger Assessment by Comparison to the Airborne Visible/Infrared Imaging Spectrometer. IEEE Transactions on Geoscience and Remote Sensing, volume 41, p. 1297-1310. |
| [Roberts2012] | (1, 2) Roberts DA, Quattrochi DA, Hulley GC, Hook SJ and Green RO. 2012. Synergies between VSWIR and TIR data for the urban environment: An evaluation of the potential for the Hyperspectral Infrared Imager (HyspIRI) Decadal Survey mission. Remote Sensing of Environment, volume 117, p. 83-101. |
| [Roberts2015] | Roberts DA, Dennison PE, Roth KL, Dudley K and Hulley G. 2015. Relationships Between Dominant Plant Species, Fractional Cover and Land Surface Temperature in a Mediterranean Ecosystem. Remote Sensing of Environment, volume 167, p. 152-167. |
| [Roberts2017] | Roberts DA, Alonzo M, Wetherley E, Dudley K and Dennison P. 2017. Scale in Remote Sensing and GIScience Applications. Chapter: Multiscale Analysis of Urban Areas using Mixing Models, p. 247-282. |
| [Roth2012] | Roth KL, Dennison PE and Roberts DA. 2012. Comparing endmember selection techniques for accurate mapping of plant species and land cover using imaging spectrometer data. Remote Sensing of Environment, volume 127, p. 139-152. |
| [Settle1993] | Settle JJ and Drake NA. 1993. Linear mixing and the estimation of ground cover proportions. International Journal of Remote Sensing, volume 14, p. 1159-1177. |
| [Somers2009] | (1, 2) Somers B, Delalieux S, Stuckens J, Verstraeten WW and Coppin P. 2009. A weighted linear spectral mixture analysis approach to address endmember variability in agricultural production systems. International Journal of Remote Sensing, volume 30, p. 139-147. |
| [Somers2010] | (1, 2) Somers B, Delalieux S, Verstraeten WW, van Aardt JA, Albrigo L and Coppin P. 2010. An automated waveband selection technique for optimized hyperspectral mixture analysis. International Journal of Remote Sensing, volume 31, p. 5549-5568. |
| [Somers2011] | (1, 2) Somers B, Asner GP, Tits L and Coppin P. 2011. Endmember Variability in Spectral Mixture Analysis: A review. Remote Sensing of Environment, volume 115, p. 1603-1616. |
| [Somers2013] | Somers B and Asner GP. 2013. Multi-temporal hyperspectral mixture analysis and feature selection for invasive species mapping in rainforests. Remote Sensing of Environment, volume 136, p. 14-27. |
| [Somers2014] | Somers B and Asner GP. 2014. Tree species mapping in tropical forests using multi-temporal imaging spectroscopy: wavelength adaptive spectral mixture analysis. International Journal of Applied Earth Observation and Geoinformation, volume 31, p. 57-66. |
| [Sonnentag2007] | Sonnentag O, Chen JM, Roberts DA, Talbot J, Halligan KQ and Govind A. 2007. Mapping tree and shrub leaf area indices in an ombrotrophic peatland through multiple endmember spectral unmixing. Remote Sensing of Environment, volume 109, p. 342-360. |
| [Tompkins1997] | Tompkins S, Mustard JF, Pieters CM and Forsyth DW. 1997. Optimization of endmembers for spectral mixture analysis. Remote Sensing of Environment, volume 59, p. 472-489. |
| [Youngentob2011] | Youngentob KN, Roberts DA, Held AA, Dennison PE, Jia X and Lindenmayer DB. 2011. Mapping two Eucalyptus subgenera using multiple endmember spectral mixture analysis and continuum-removed imaging spectrometry data. Remote Sensing of Environment, volume 115, p. 1115-1128. |