Exercise: MESMA
For issues, bugs, proposals or remarks, visit the issue tracker.
We will unmix our images with two different libraries and compare the results:
- The library we created with the IES pruning technique.
- The library we created by manually selecting spectra from the image.
Once we have selected the best library, we can do unmixing on several levels:
- We start with a pixel classification (based on 2-EM models).
- Then we follow with 3-EM and 4-EM models.
Data Used
Use the image apex_2015_180_smooth and the libraries library_ies.sli and library_from_image.sli (you might have given these libraries a different name!).
We will always use the standard constraints of 0.025 RMSE, -0.05 and 1.05 minimum and maximum fraction constraints, and 0 to 0.80 shade constraints.
Part 1: Basic MESMA with the IES pruned library
Spectral Library:
- Select the library library_ies.sli.
- Select the metadata class named Meta2.
- The algorithm automatically selects all 2- and 3-EM models. We leave this as it is.
- Check on the Advanced Settings tab that the Reflectance scale factor is automatically set to 1.
Constraints:
- We don’t change any constraints.
Input image:
- Select the image apex_2015_180_smooth.
Run MESMA:
- We leave the output name as is and make sure the output opens in QGIS.
- Click RUN.
Expect it to take a few moments. Don’t be alarmed if QGIS freezes for the duration of the calculations.

Results
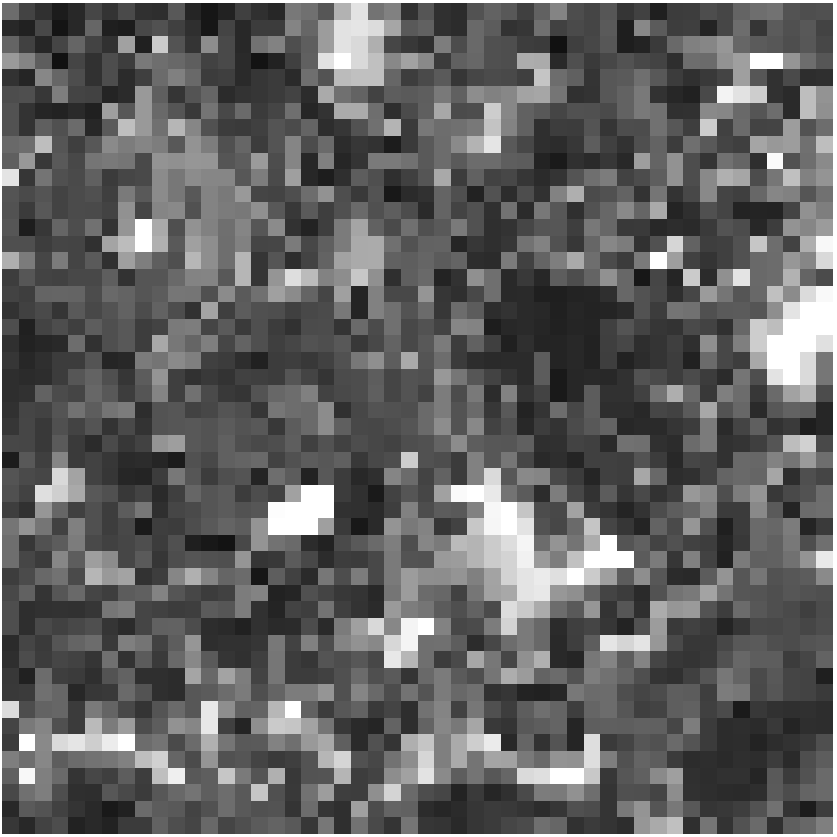
The output RMSE can be found in the image named apex_2015_180_smooth_mesma_…_rmse.
Initially this image is very dark. Set the min and max values to 0 and 0.025 in the layer properties to get a more dynamic image. The highest error values seem to be on some roofs.
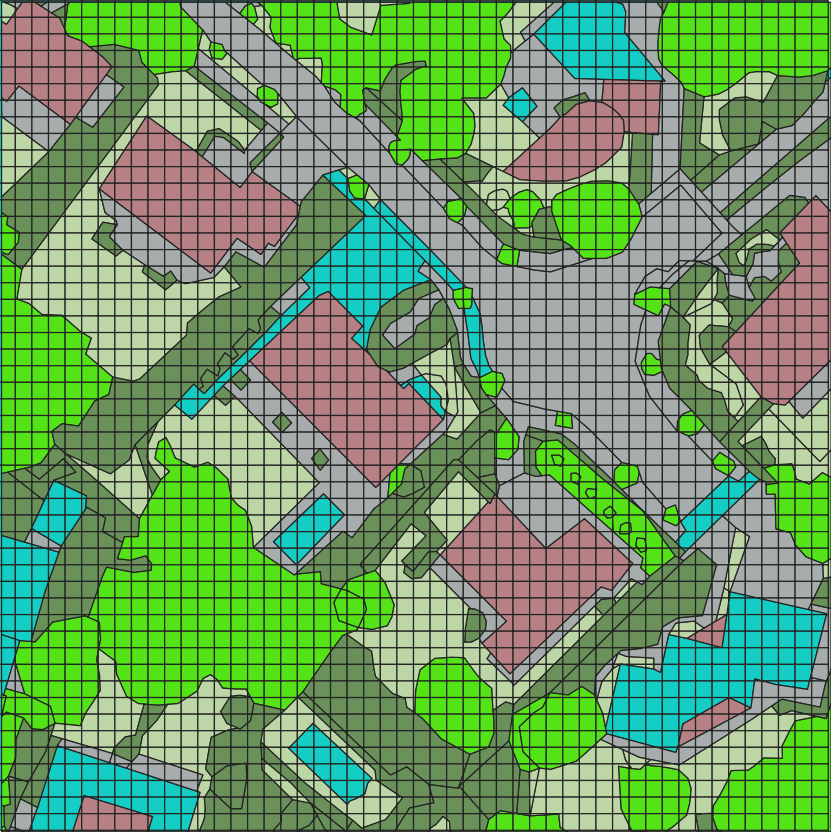
Open the validation shape file and compare your results. The folder also includes a style file for the validation shape file.
The fractions are in the image named apex_2015_180_smooth_mesma_…_fractions. This is a multi-band image, but only is useful if each band is viewed separately.
The models image is the most interesting from a visual analysis point of view. The models image comes with a csv file
and both are not directly useful for analysis. We need the MESMA Visualisation Tool to analyse them. Normally it
opens automatically. Otherwise click  .
.
- The Visualization Tool shows two menus: Classes and Class-models. The Classes show you the pixels that have a given class in their model, whether it is part of a mixture or found solely. The Class-Models show the different models you chose when you were setting up MESMA.
- The number of pixels indicate how often a model was used.
- You can turn on/off classes and class-models, but each time you want to see the changes on the image, you have to use
the View button
 .
. - You can change the colors of your classes and class-models, but you have to select a row, right click and then choose ‘Set Color’. This is a bit confusing as you might also by accident change the color of other previously selected rows.
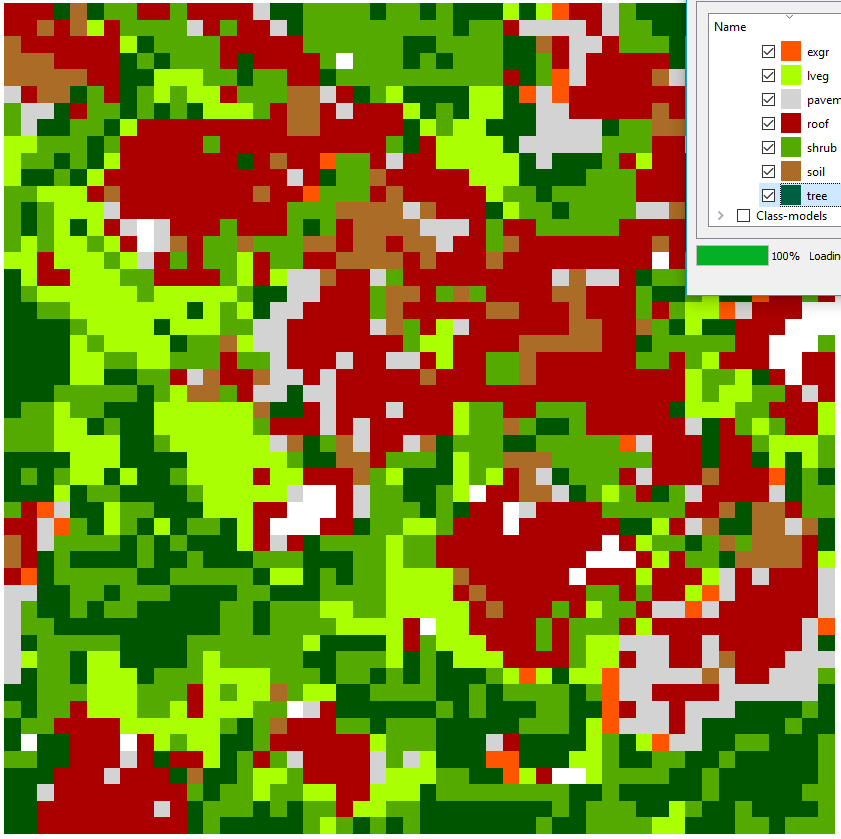
We already see a quite good result. There is some confusion between pavement and roofs, but vegetation is classified rather well. Mind though that this is a very basic visualisation, drawing one class on top of another! Select each class individually to see where they are found! Then compare this with the fraction image to see if the presence of each class is significant or not.
Part 2: Basic MESMA with the manually created library
Now we perform the same exercise, but with the library we created by selecting spectra manually from the image.
Results

A lot of unmodeled pixels in this image. The library was oversimplified.
What is your conclusion? Was the unmixing successful? Explain why there is so much confusion between pavement and roofs, and between shrubs and trees.
Go beyond
We can try a bunch of other things:
- Use the full (unpruned) library: this will be much slower, but will it be better?
- Use the advanced MESMA techniques like Stable Zone Unmixing or Band Weighing
- Include 4-EM or 5-EM Models: this will slow down your search, but will the results improve?