Exercise: Brussels
For issues, bugs, proposals or remarks, visit the issue tracker.
Objectives
- Learn to work with the MESMA toolbox in QGIS
- Use MESMA as a sub-pixel classification method:
- Interpret the results visually
- Compare performance when using different libraries
- Compare different MESMA techniques
- Perform a hard classification on your MESMA result
Tutorial Data Set
You can download the tutorial data set here (tutorial_data_set_brussels.zip). The zip file contains the following data:
- Apex images from 2015 with numbers 014, 14 and 180 in ENVI format
- A spectral library in ENVI format
- A validation shape file for each image
- Note: images and library have been smoothed using Savitzky-Golay filter with window size 9
Acknowledgement for the data set:
Degerickx, Roberts, Somers; 2019; Enhancing the performance of Multiple Endmember Spectral Mixture Analysis (MESMA) for urban land cover mapping using airborne lidar data and band selection; Volume 221; P 260-273
Note
It is good practice to keep all files in the same folder - especially during the exercises. Files like square arrays often go looking for library information on which they are built.
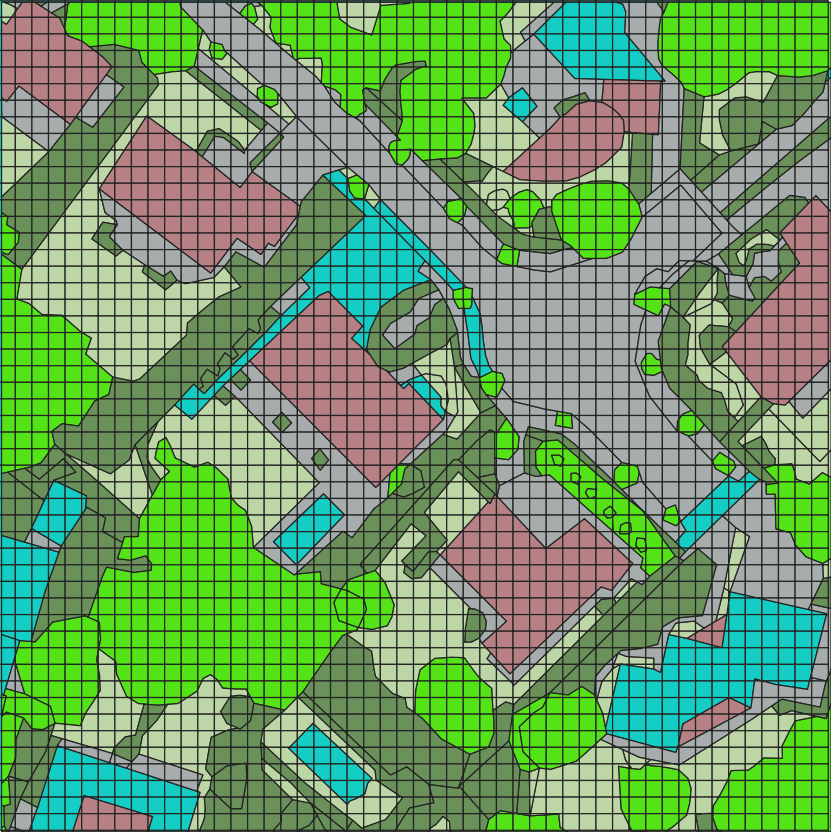
Image Inspection
- Try to visualize the images in QGIS.
To recognize the surroundings, overlay them with a map from the OpenStreetMap project (QuickMapServices plugin and Google Satellite View).
- Inspect the technical properties of the image.
- Why are the images black when first loading them into QGIS? Which bands would you use to visualize them for easy interpretation? Look-up the wavelengths of the RGB bands.
- What is the size of the image and of each pixel?
- Make a list of the land cover classes you expect to find in each image.
Creating and Optimization of Spectral Libraries
See exercises on http://spectral-libraries.readthedocs.io.
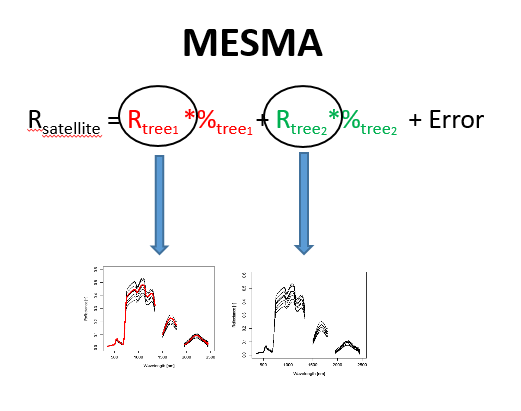
MESMA
In SMA, a mixed pixel (image) is modelled as a linear combination of endmembers (library spectra) and their fractions.
MESMA wants to account for within-class spectral variability and allows a single land cover class to be represented by multiple endmembers. As a result, the selected EMs vary on a per-pixel basis, allowing dynamic mapping of spectrally complex scenes.
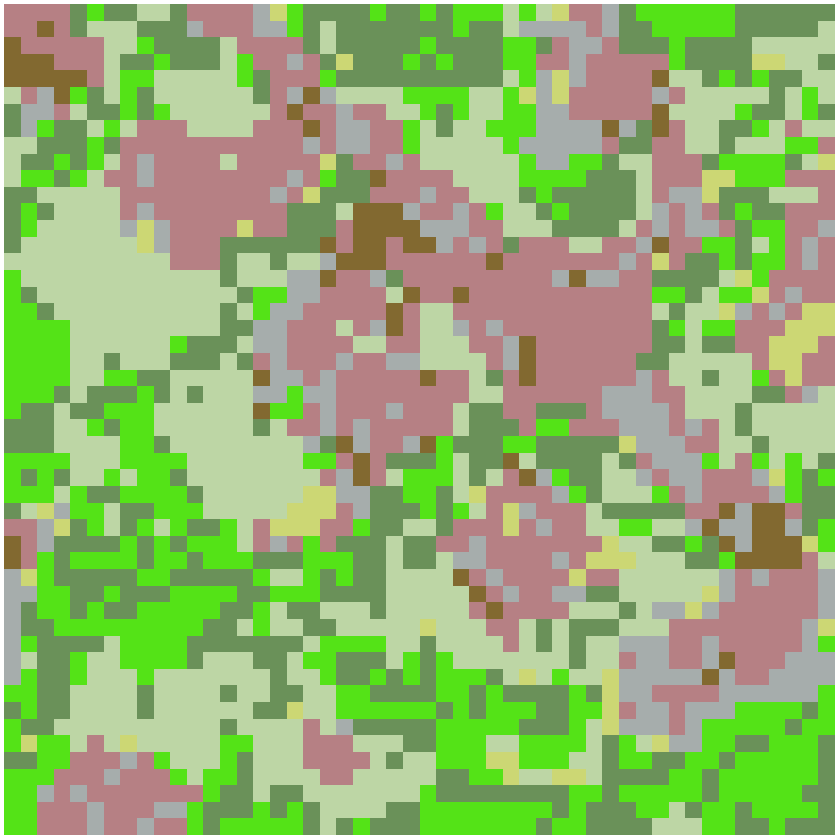
Post-Processing: Soft to Hard Classification
Lastly, we can do a soft to hard classification based on the Fraction Image (under post-processing tools): each pixel will be assigned the dominant fraction (excluding shade).